


The Mother of All Stock Market Bubbles
The long shadow of the Global Financial Crisis

Dear readers,
As the year closes, I’ve had a number of discussions with investors about the performance of stock markets. The price return of the S&P500 has been 27.3% so far – not only one of the best years in history, but also unexpected. The year started out at high valuations, and many investors expected only modest additional gains if any at all.
One of the reasons for today’s sky-high valuations goes back more than 15 years, right to the Global Financial Crisis, when central bankers launched a new monetary regime. So today I’d like to talk about the impact of this new regime – once again, I’m pretty sure you haven’t seen it laid out in this way before!
Hope this is interesting and helpful. If so, please drop me a ‘like’, and if you haven’t subscribed, please sign up! It’s been a good year for THE ECONOLOG with your support, and I hope to continue the momentum into the next year. Many thanks!

From time to time, it makes sense to take a step back from the daily hustle and watch things from a little distance. Get out of the clutter of news, opinions on daily ups and downs, news on random achievements which nudge this or that stock higher.
American stock markets set new records in recent weeks. The S&P500 exceeded the 6,000-point threshold, and the Wilshire 5000 Index, the broadest stock market index in the U.S. (and the world), went above 60,000. Nice reason to pop some corks!
There’s just a little problem. Market valuations are at record levels as well – insanely high levels that should have any investor at the edge of his seat. There are always voices which rationalize record prices – a business revolution going on (the Internet transforming the economy), a financial revolution which eliminates risks (Alan Greenspan’s derivatives), and other impacts which supposedly make sure that “this time it’s different”. Actually, something is really different this time, but will it bail out markets this time? I’ll get back to that in a moment, but first let’s take a quick look at some numbers. I don’t want to sound alarmist, just lay out some numbers.
Records, records everywhere

(Dividend yield of the S&P500. Source: Gurufocus.com)
Investors buy stocks because they want to get something in return – dividends or a higher sell price. Dividend income today of 1.19% is at the lowest level in the history of the index, together with the time during the peak of the Internet/ telecom bubble at the turn of the millennium. In the years which followed, the S&P500 went down more than 45%.
I recalculated another interesting valuation barometer, the Wilshire 5000-to-GDP ratio, with this week’s market data. The index is also called the ‘Buffet indicator’, as Warren Buffet referred to it a few times in his market comments.
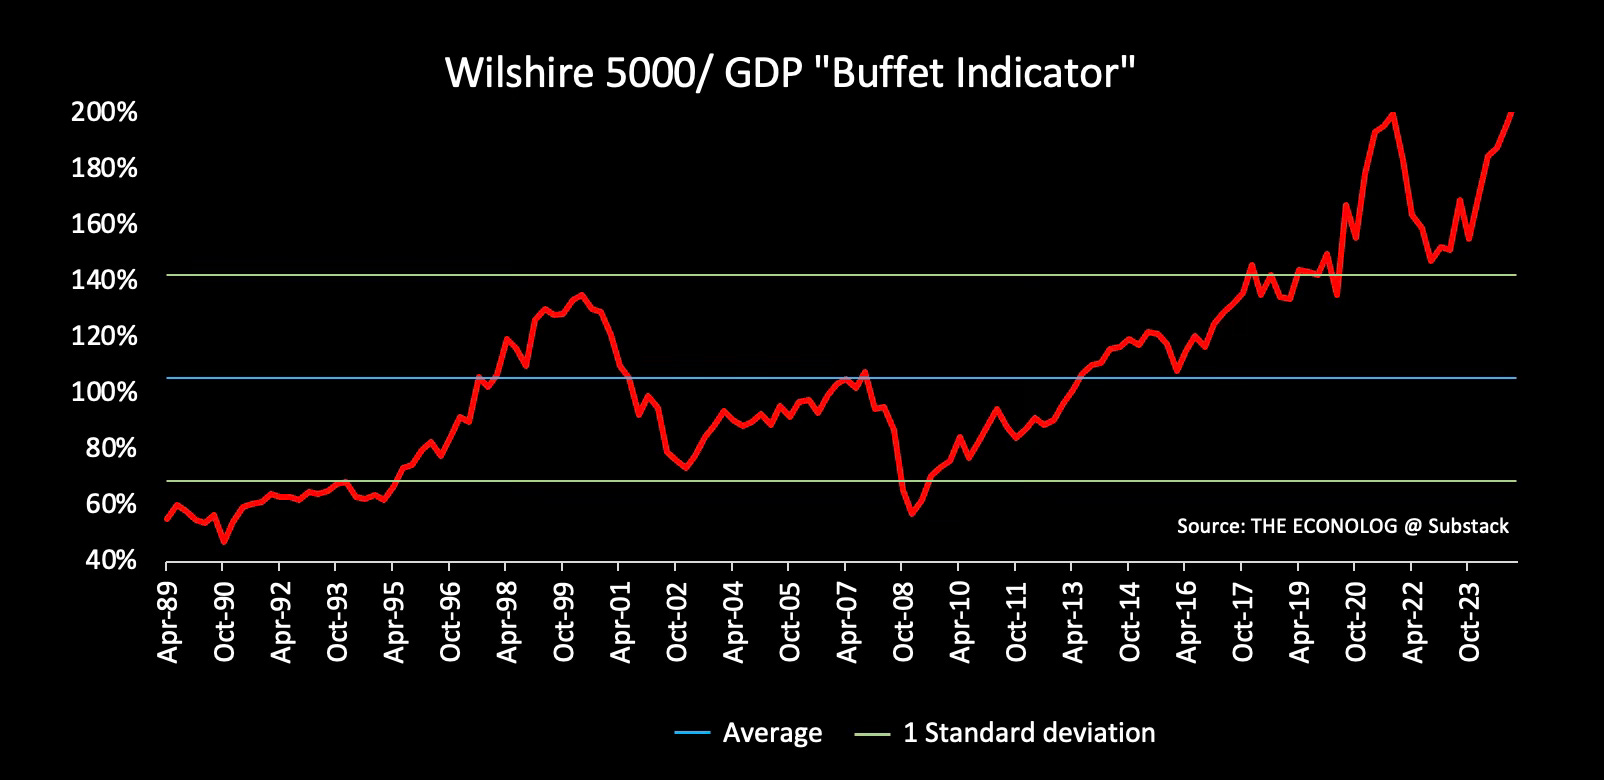
(Data per Dec 12, 2024)
The Wilshire/ GDP ratio is at the highest level ever at over 200%. It is more than two standard deviations above the historical mean which is expected to happen only about 2% of the time. The previous peak was reached in late 2021, after which the market declined by 25%.
Ok – so is there something like a fair value?
Pricing of all financial instruments is interconnected. Basically, you start with a risk-free asset (in practice, treasury bonds, even though they are not really risk-free but have interest-rate risk) and add risk premiums. The riskier a financial instrument, the larger the premium. For corporate bonds, the premium (‘spread’) currently is around 80 basis points, a record low. For high-yield bonds, around 2.6%, another record low. For equities, most researchers assume it is somewhere around 4-5%.
So let’s plug in the numbers in a dividend valuation model – D1 of $79, a risk-free rate of 4.3%, and a risk premium of 4%, and the fair value of the S&P500 is, shocker, 2,400 points. With all the other market data as they are, you’d have to go all the way down to a risk-free rate of 2% to get to a fair value of 6,087 points, pretty much this week’s market closing value.
Now that’s just an abstract model, but it’s not much different from what investment bankers use to price new issues and M&A deals. It should be directionally right, and in the order of magnitude. And it’s worked well years ago.
Some people might say, well, earnings of the AI companies are rising so quickly, the market will soon grow into its current valuation level, soon it will match, like a kid which grows into clothes bought a size too large?
Well, not really. First of all, it’s only one company whose earnings grow quickly, Nvidia. Second, the overall market’s dividend would have to reach $200 (from $79 today). That’s not going to happen quickly.
Heading for a crash?
Remember that after the collapse of Lehman Brothers, and the last-second bail-outs of Merrill Lynch and AIG, the banking systems in many countries were frozen stiff with fear. Banks didn’t lend any longer, and market liquidity disappeared. Global central banks under the lead of the U.S. Federal Reserve adopted a new monetary regime in response, called an ‘ample reserves regime’, essentially drowning financial markets in liquidity.
The Fed added more than 8 trillion dollars to markets in several rounds of quantitative easing operations. QE is, in principle, textbook central banking: the Fed buys treasury bonds and pays with fresh central bank money, which expands money supply. What made QEs different were the size and speed of security purchases. Since its founding and up to the GFC, i.e. over a timespan of almost 100 years, the Fed had bought $800 billions in treasury bonds; in the 14 years which followed it bought more than $8 trillions (treasuries and mortgage bonds). Most of that money never reached the real economy but went straight into financial markets – and ironically, most of it went straight back to the Fed. Commercial banks deposited it in their reserve accounts at the Fed (more than $4 trillion at the peak, and still more than $3.2 trillion today), and money market funds in the Fed’s reverse repo facility ($2.5 trillion at the peak). Much of the rest went into the stock market.

(Hundreds of billions of QE dollars went straight into stock markets, driving up prices and equity valuations until July 2022. Just as the market was in a phase of correction, OpenAI released ChatGPT-4 in March 2023, kicking off the AI/ tech rally.)
The liquidity bubble ended in spring 2022, when the Fed switched into reverse mode with quantitative tightening (QT). The S&P500 went down 25% and meandered around the 4,000-point mark for several months, when an obscure small company called OpenAI announced the latest and most advanced version of its chatbot ChatGPT-4. The announcement kicked off an unprecedented rally in the leading technology stocks. The S&P500 delivered a price performance of 54%, more than half of it stemming from the mag-7 companies.
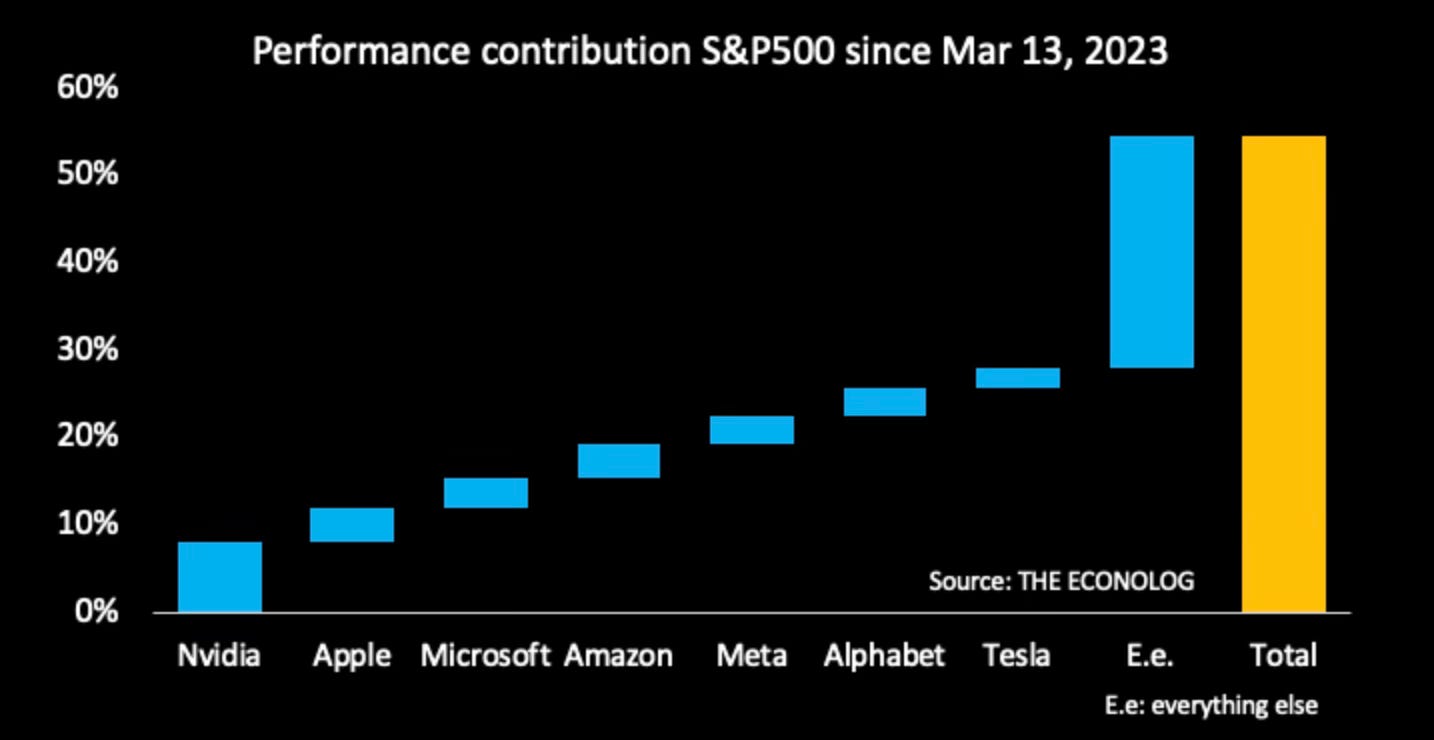
(Performance since OpenAI announced ChatGPT-4 or Mar 14, 2023)
Where to go from here? What will be the impact of the Fed’s continued draining of liquidity from markets?
The best proxy for excess money in markets is the Federal Reserve’s reverse repo facility (‘RRP’), an investment program for banks, money market funds and other players. It is one of the Fed’s tools1 to absorb excess funds in the market, and to prevent money market interest rates from falling below target levels. The program sprang into life during the last QE operation in the pandemic. To some degree it’s a really strange idea: the Federal Reserve first bought trillions of bonds from banks, and then lends the same bonds back to them, even paying higher investment income?
The RRP reached at peak volume of $2.2 trillion but is now down to $150 billion2, exactly in line with QT which has reduced the Fed’s balance sheet by $2 trillion. This is a trend which is monitored very closely by the Fed: it wants to scale down the facility, but without damaging liquidity in the market. Most likely sometime next spring, it will announce that quantitative tightening is over. But let’s not kid ourselves: the main driving force for equity markets between 2008 and 2022 is in reverse mode.
This makes the valuation problem even worse. The stock market is not consistent with other markets, with either the equity risk premium far too low or unrealistic earnings growth expectations. The scenario looks a lot like the Internet/ telecom bubble in 1999/2000, but with indicators like the Wilshire 5,000/ GDP ratio even more out of line.
On balance I think the market has become very vulnerable to external shocks – much more than on average. I think it makes a lot of sense to adjust return expectations over the next few years, and to consider personal risk tolerance and loss limits.
And just to point out again – the models I discussed in this posting are high-level frameworks which are not useful to pinpoint the market. But they are very helpful to assess the order of magnitude and gaps to historic values. And I think they show we are at unprecedented levels of risk.
Happy to hear your thoughts!
All the best,
John
The other tool is Reserve accounts at the Fed, into which banks deposit surplus funds and received an interest rate, the IORB. Before 2008, banks didn’t receive interest on central bank accounts, and therefore didn’t hold any money there. Today, they have $3.2 trillions in those accounts.
Reverse repos with domestic banks; excluding foreign official and international accounts
I think you make some very interesting points. We are seeing extraordinary speculation (ie. fartcoin market cap at $700mm). In 2000, as you point out, the market was down a lot. But tech had been 45% of the S&P and many non-tech names did just fine. I just wonder what the best asset to own will be going forward. I do not see inflation going away so, for me, no bonds. While I think that paying 30+ times earnings for MSFT is silly, I think there are more than a few decent equity values out there.
the thing is, where would the money go once it collapses? There is no place to go.
How would it collapse is because of liabilities that need to be paid of en-masse on a global scale that can only be paid off by selling assets. Probably due to a boom in people of pensioner age.